
Our Approach
The TIDES approach uses a relatively low-cost and easily transferable methodology designed to engage communities directly in the research and management of their coastal areas.
By suspending high resolution cameras above the rocky intertidal habitat, we capture thousands of images of study sites approximately 180m2 in size. These photos are then stitched together using structure from motion software (Agisoft Metashape) to create 3D habitat maps. We repeat these large-area imaging surveys bi-annually to create a long term monitoring database that captures seasonal variation in community composition.
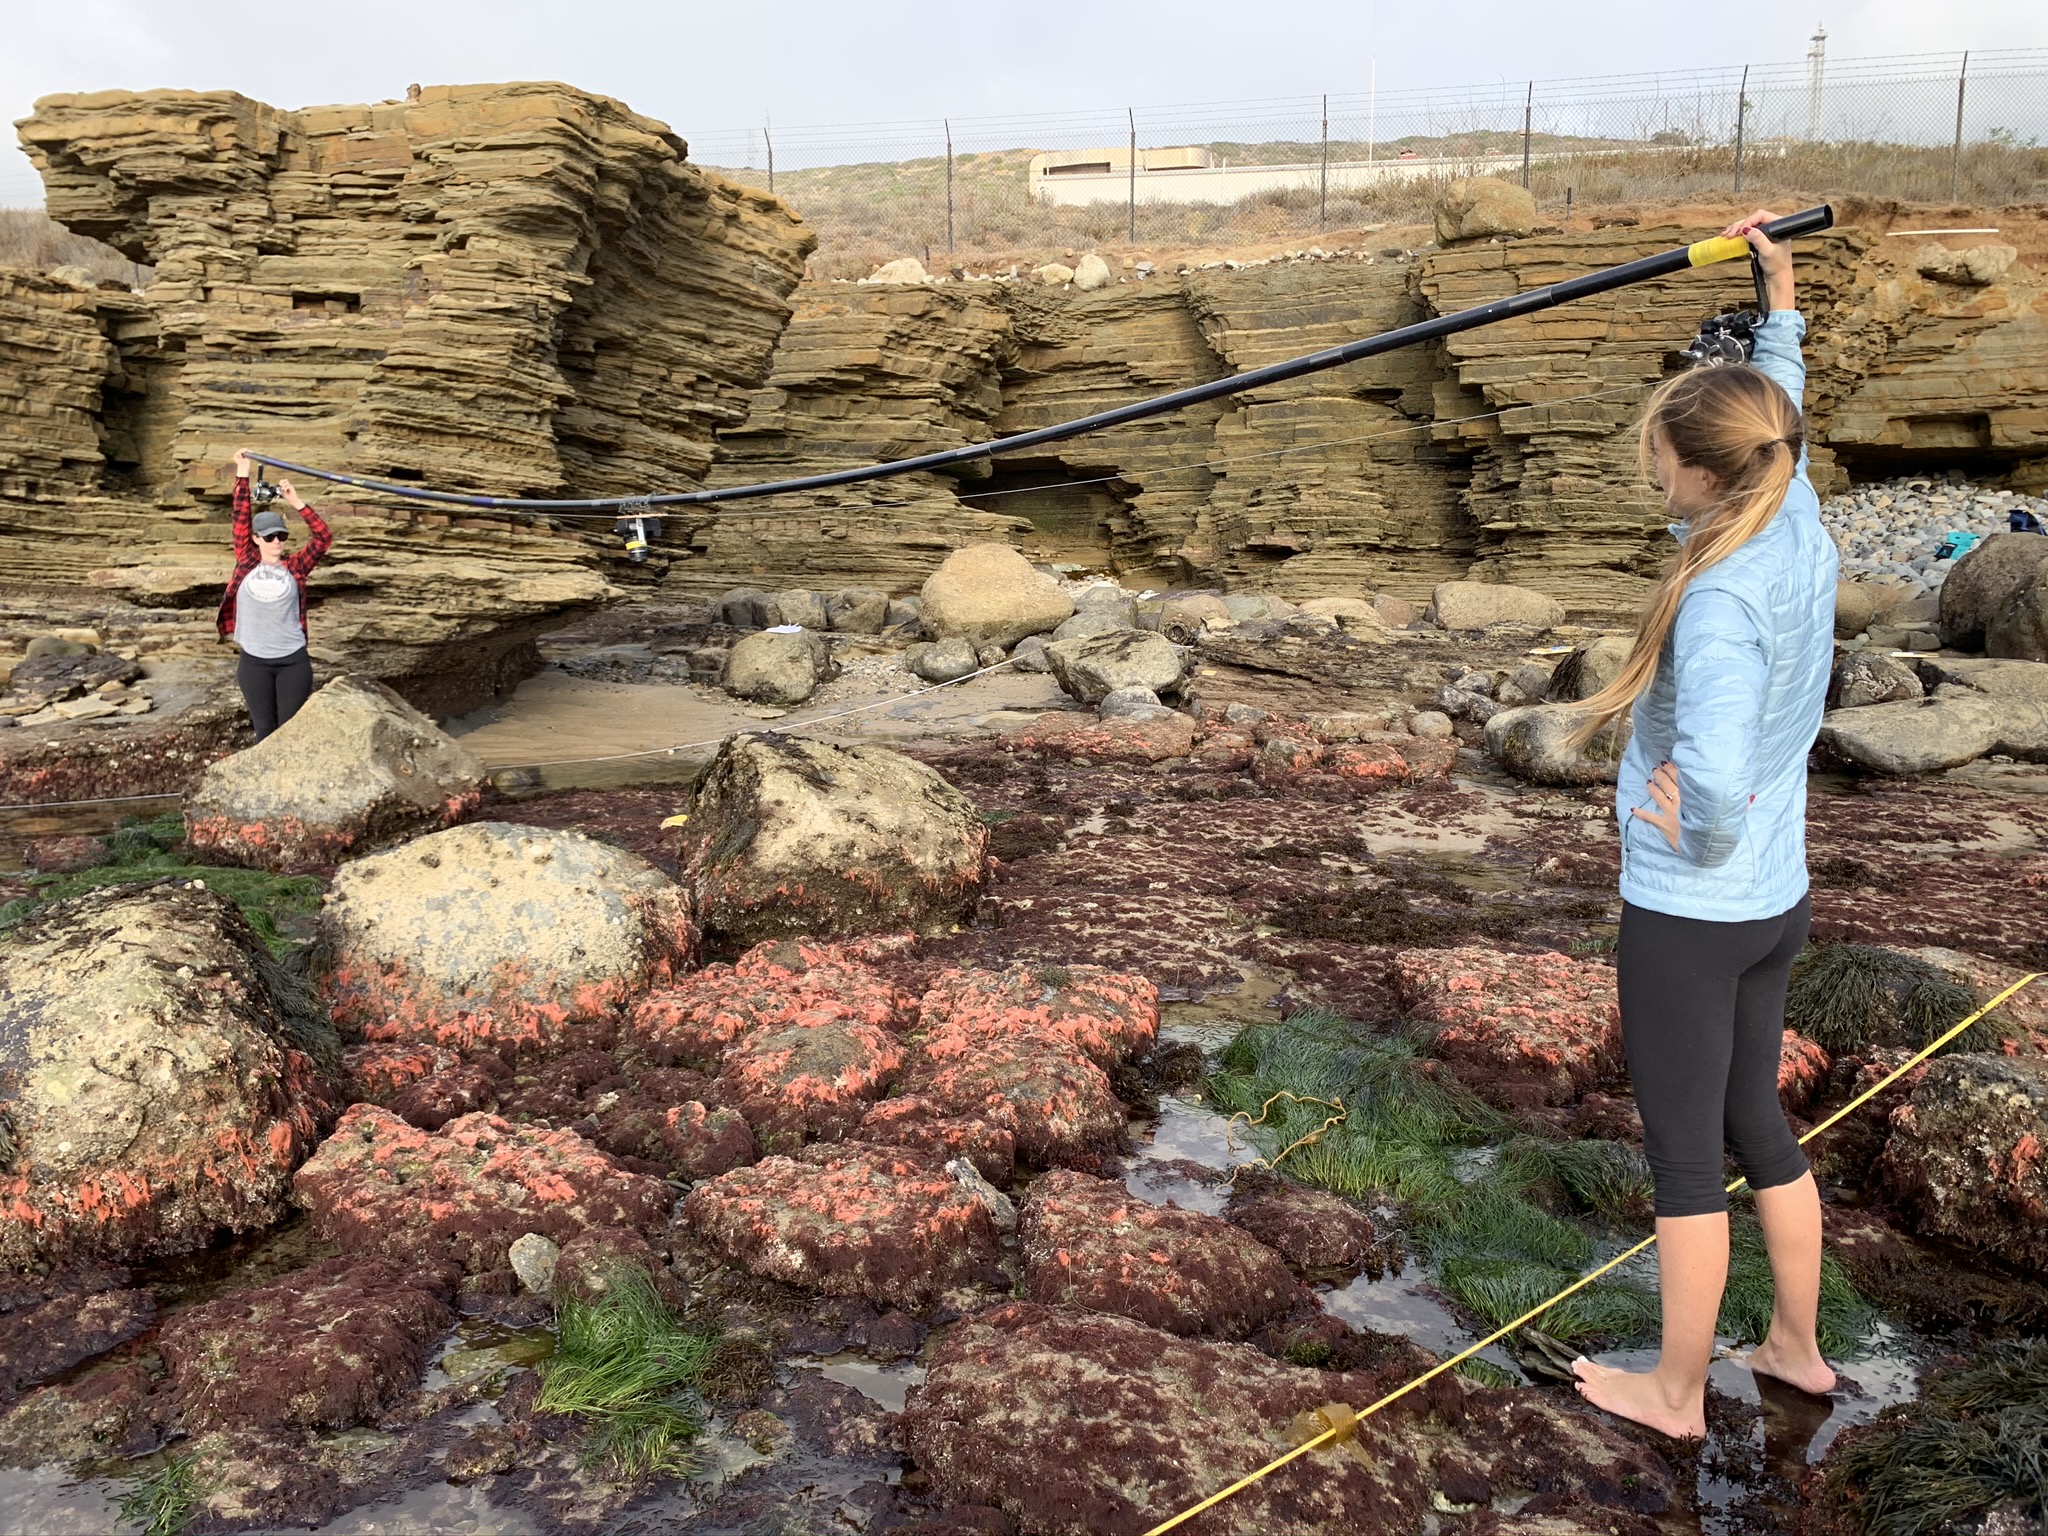
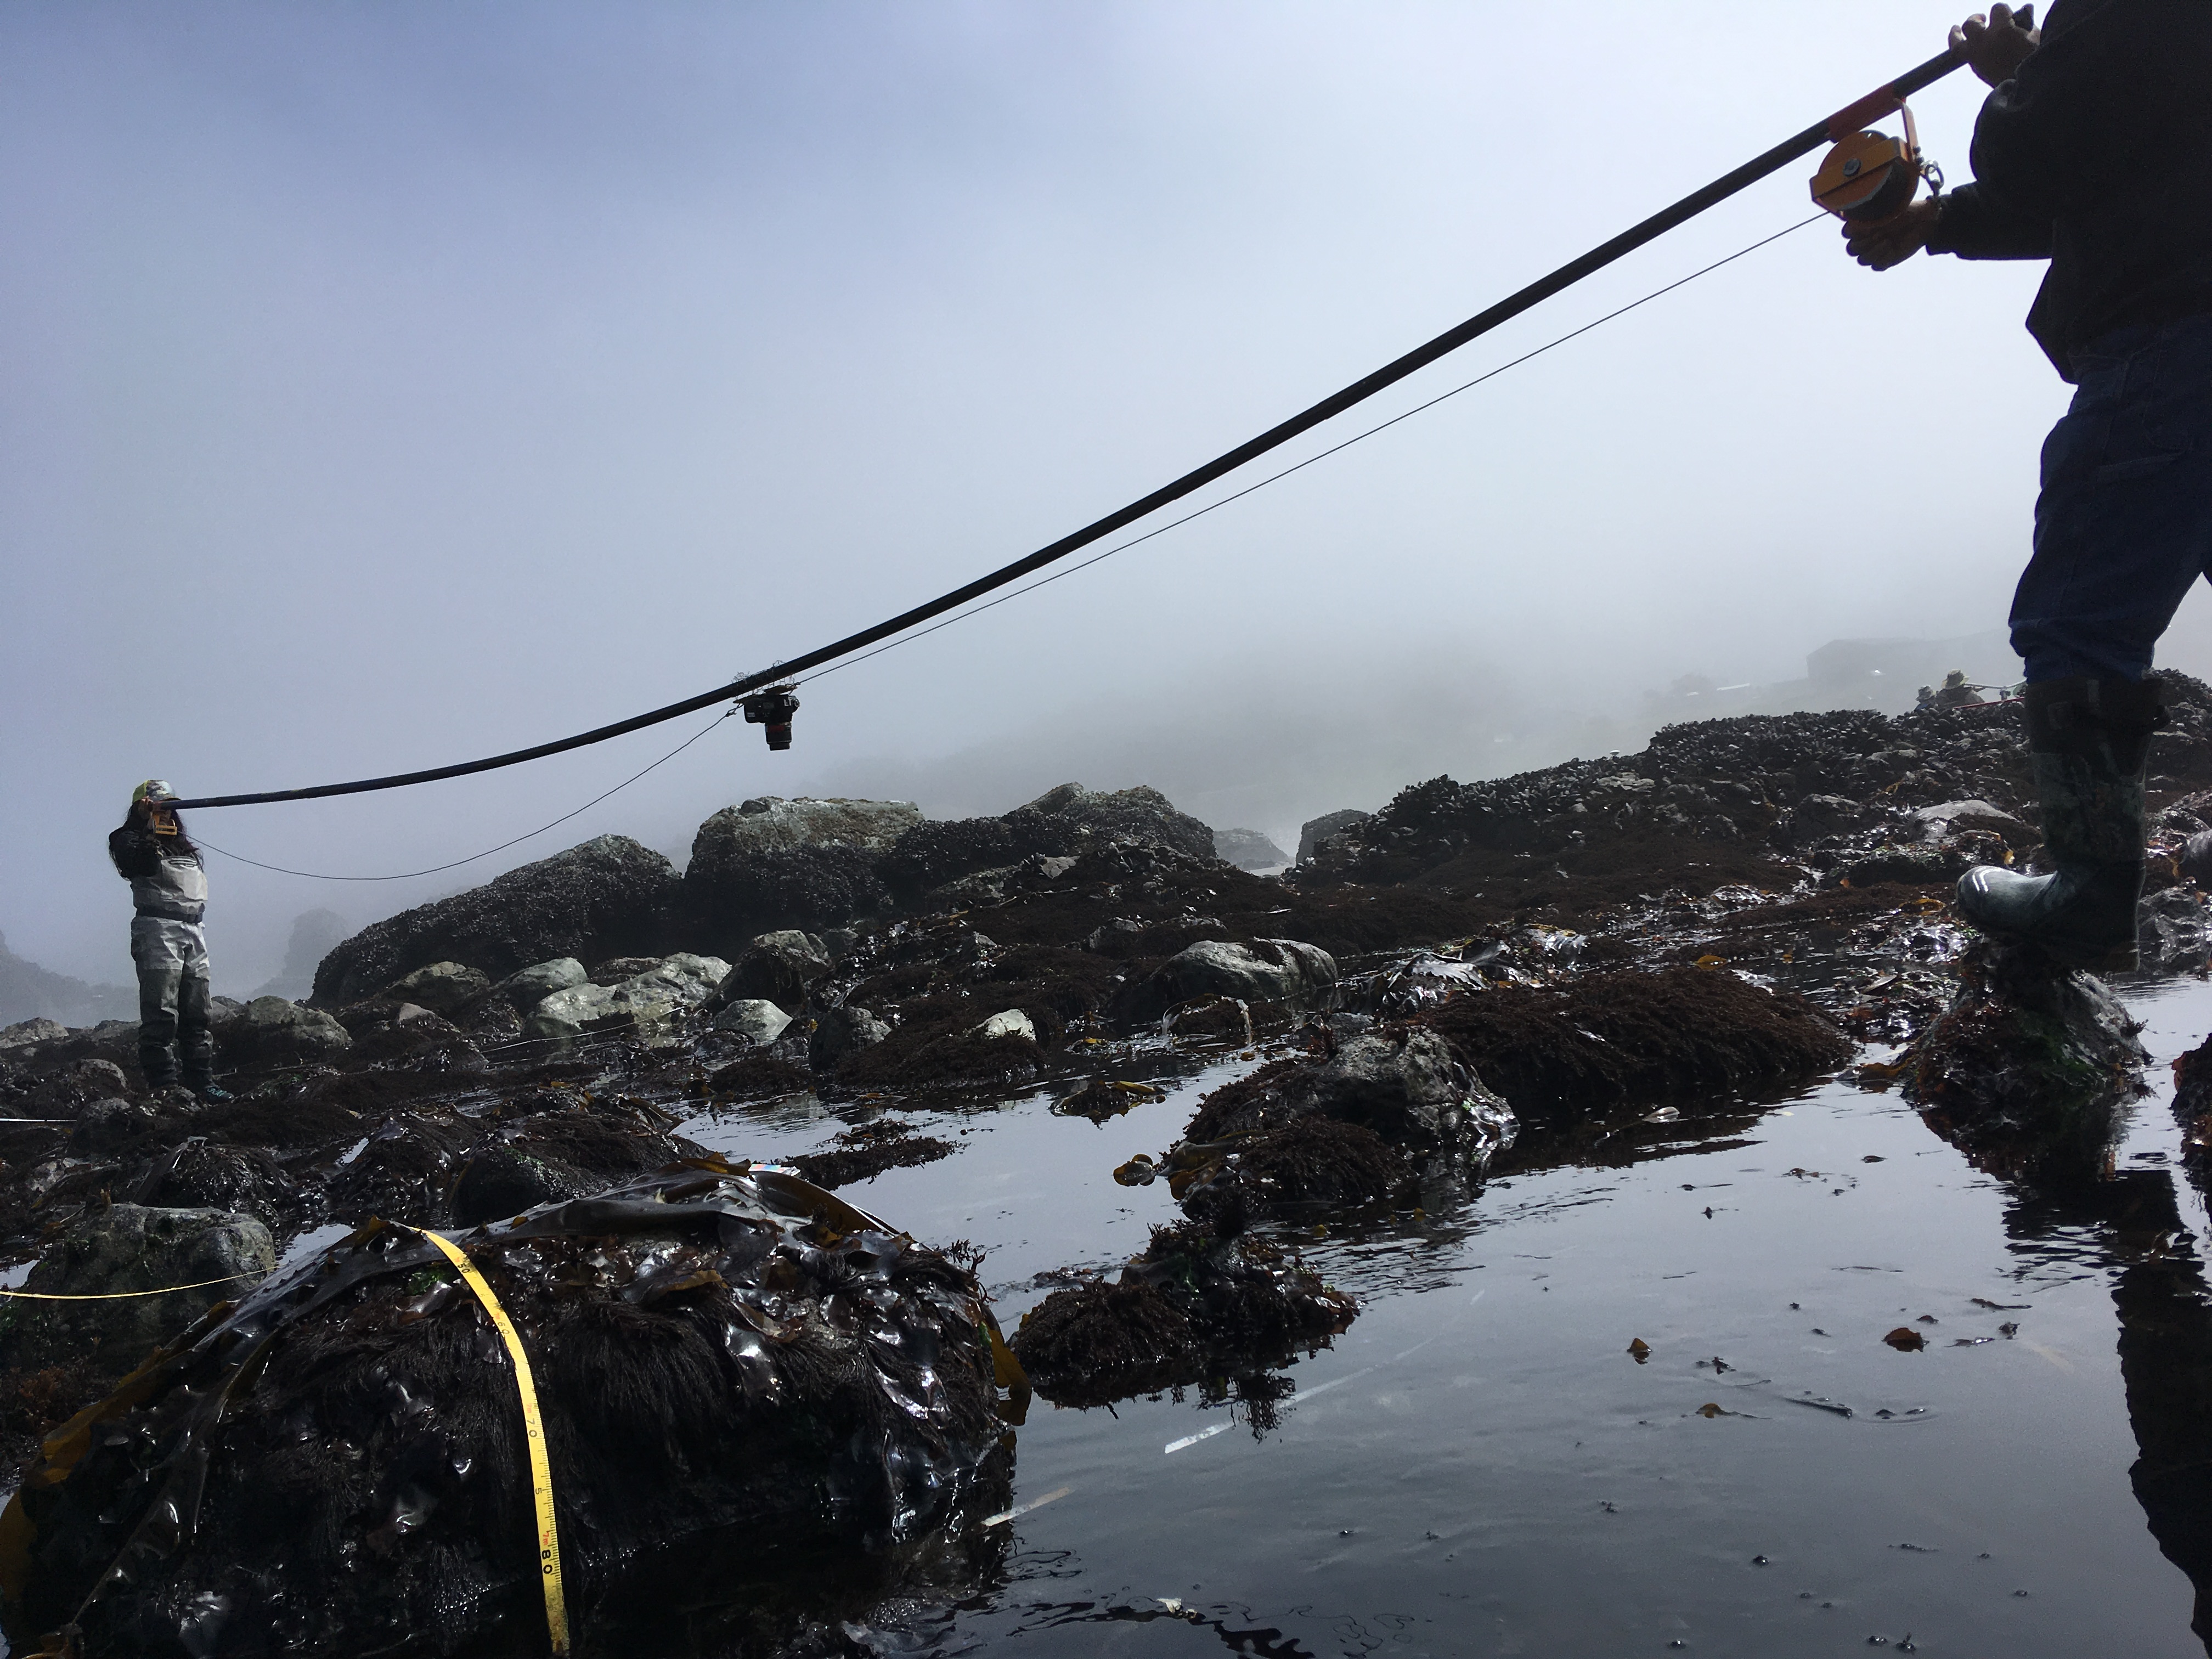
This image shows TIDES team members capturing imagery of the rocky intertidal habitat during a field survey. The camera is mounted to a ~24 foot carbon fiber pole, held about 3 feet above the benthos, and reeled slowly across the site while continuously taking a photo approximately every second.
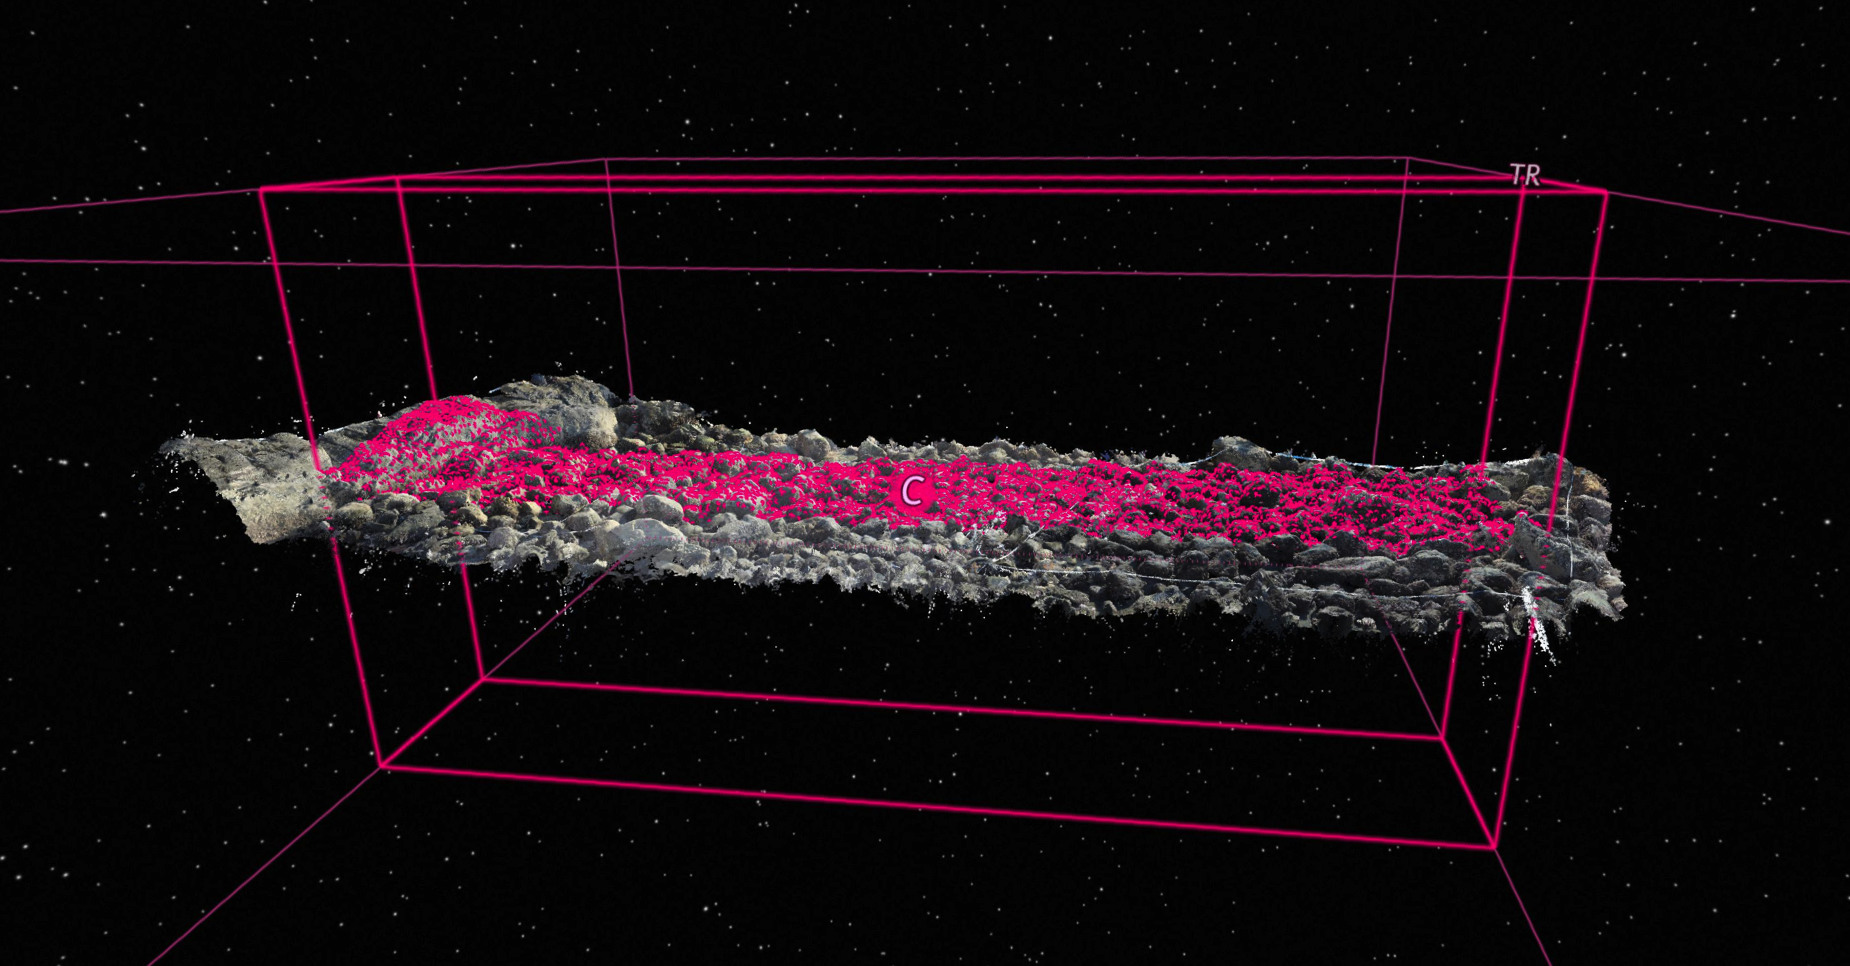
The 3D models built from the images are uploaded into a custom software created at UCSD called Viscore, where ecological data, such as community composition as percent cover, can be extracted. In Viscore, each biological data point has associated physical data, including elevation, which is something that is not possible to achieve using traditional field methods.
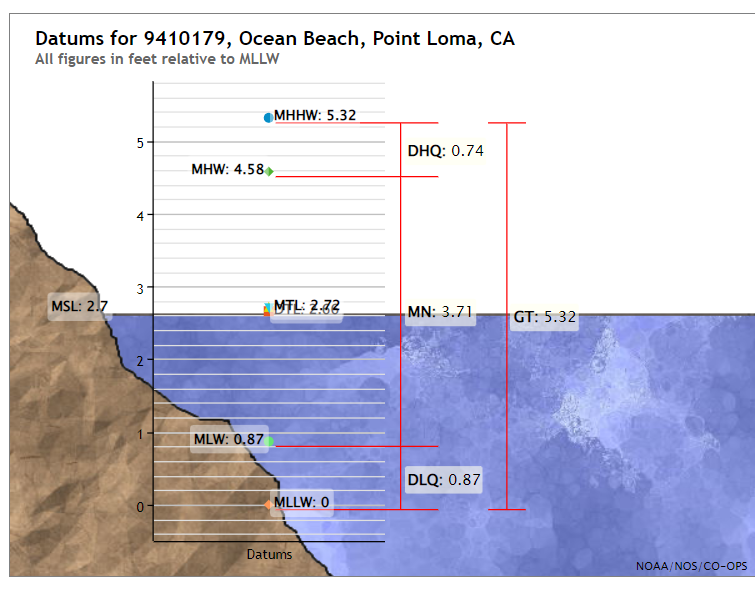
Scientists have been able to determine sea level by region using a combination of tide gauges and buoys, and specific calculations, as seen by this image of a NOAA tidal station. The TIDES team uses this information alongside the biological data we gather to determine how short and long term changes in sea level may influence the community composition and patterns of zonation in the rocky intertidal.
In this way we can better understand the vulnerability of these ecosystems to changes in sea level in order to better support climate change management plans for our iconic coastal seascapes!